SDTEST® has 38 different VUCA polls that calculate the 13,643 correlation values between stages of development according to the theory of Spiral Dynamics and answer options of these 38 polls.
We invite curiosity about the systemic mechanisms behind this correlation. There may be hidden variables that provide alternative explanations.
0.1004 between the Staff reductions and the Purple stage.
The critical value of the correlation coefficient for a normal distribution, by William Sealy Gosset (Student) r = 0.0862. This positive correlation of 0.1004 meets the reliability criteria but does not necessarily imply causation.
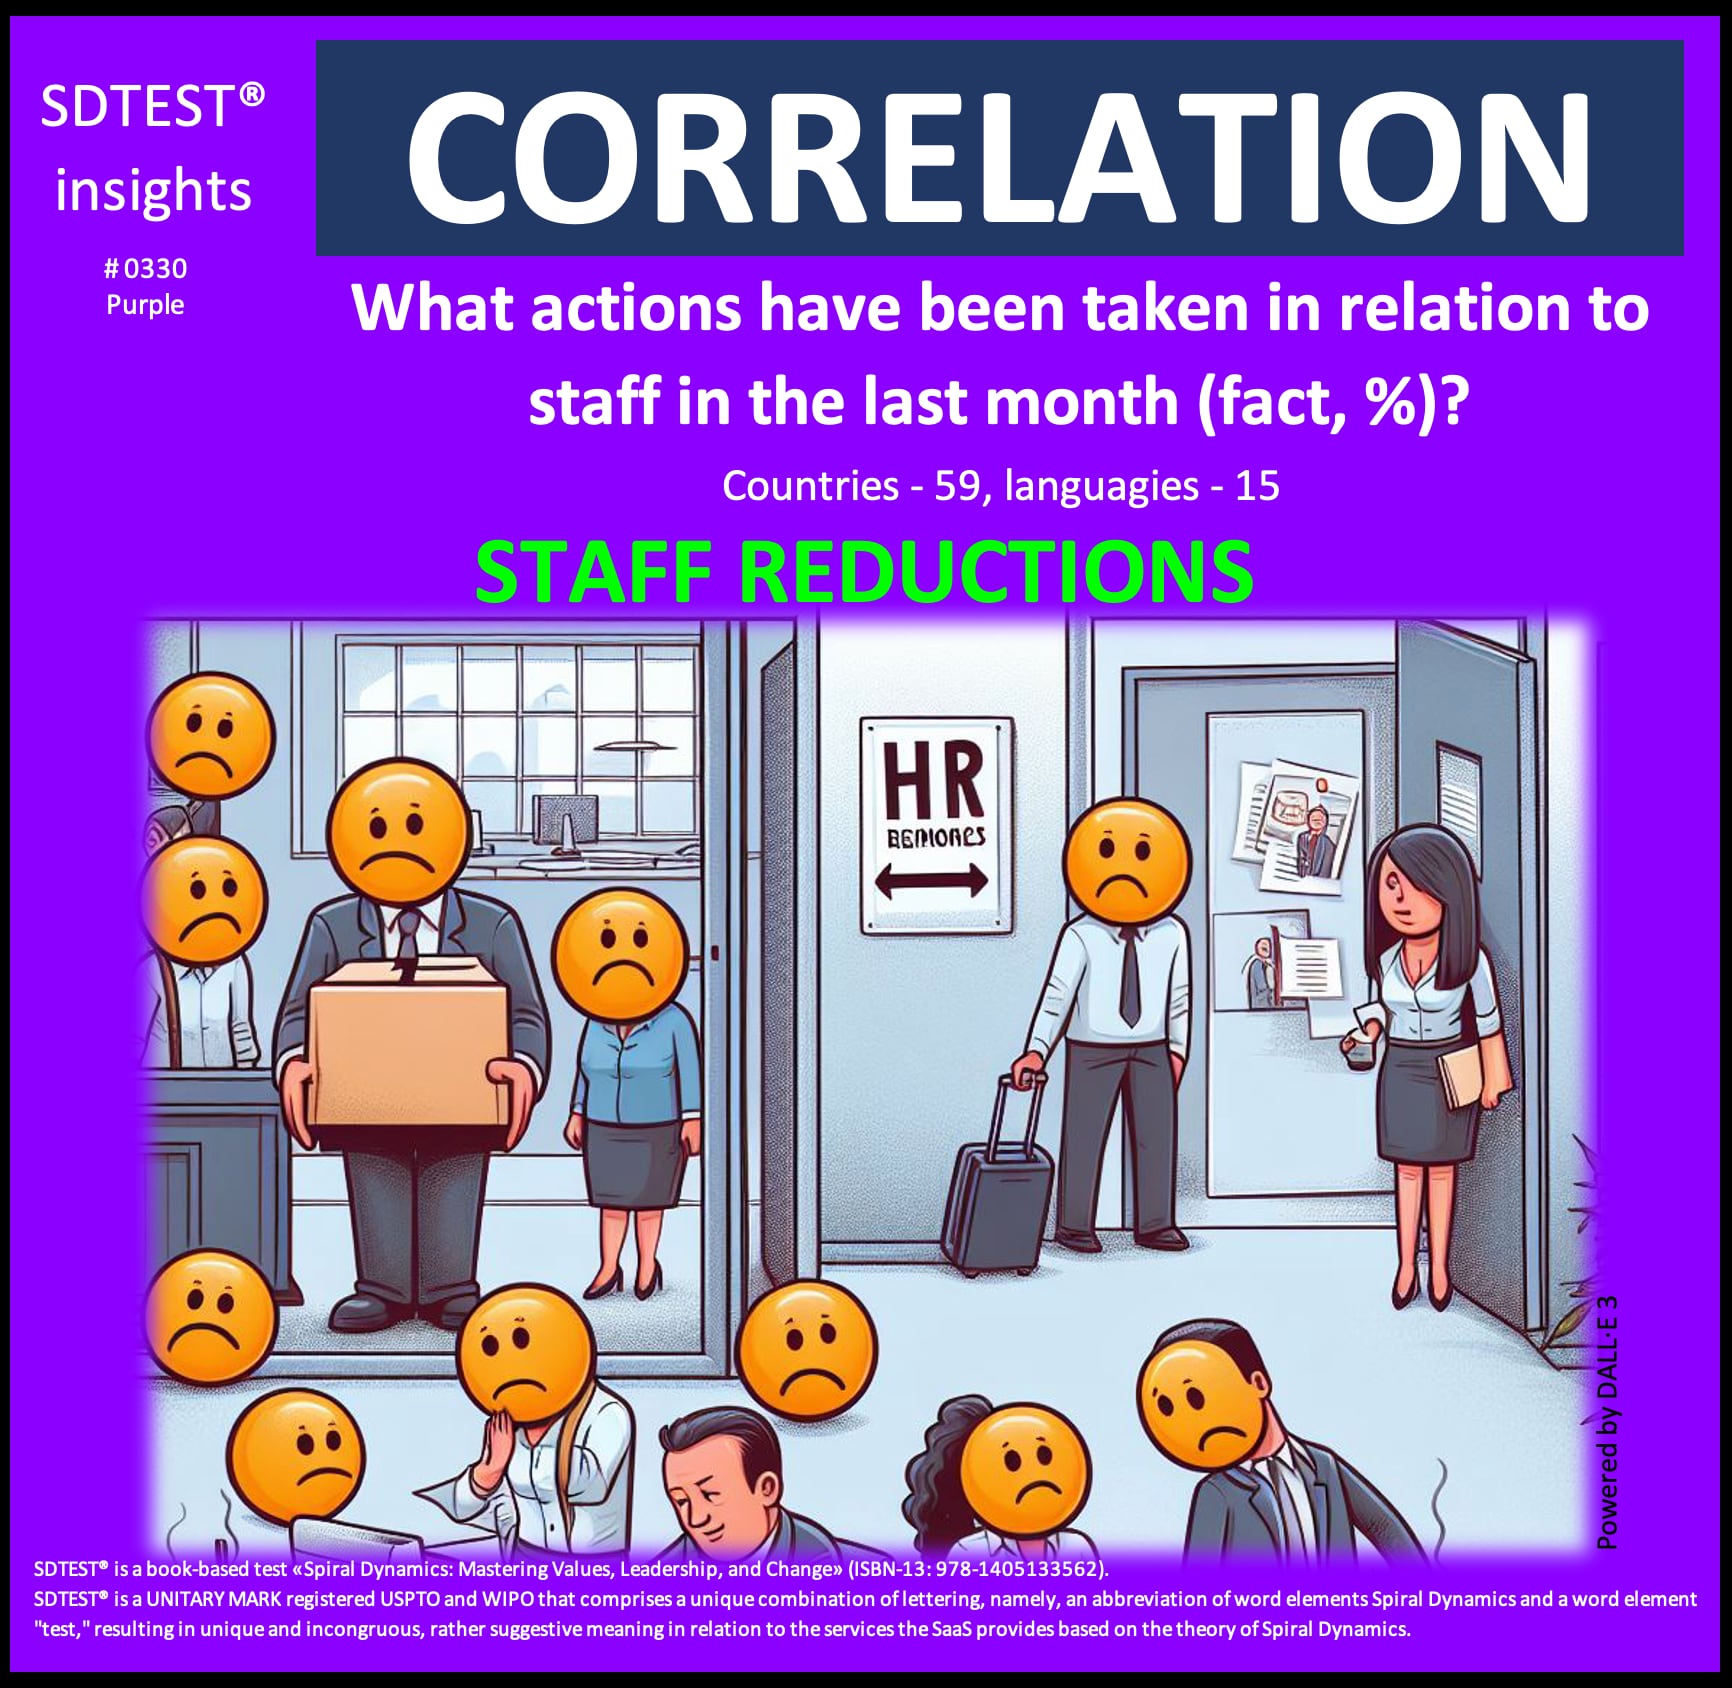
This positive correlation of 0.1004 between Staff reductions and the Purple stage reveals fascinating insights when viewed through the lens of the Purple value system:
Organizational Perspective:
Organizations operating within the Purple mindset might interpret this correlation as:
- A sacred duty to maintain tribal balance and harmony through periodic cleansing rituals.
- Following ancestral wisdom, natural cycles require periodic reduction to maintain spiritual equilibrium.
- A sign from higher powers indicating the need to preserve the organization's sacred core.
These organizations might respond by:
- Conducting ceremonial farewell rituals for departing employees
- Consulting spiritual advisors or elders before making staffing decisions
- Creating sacred spaces for remaining employees to maintain group cohesion
Team Perspective:
Teams operating from a Purple mindset might approach this correlation by:
- Viewing it as a mystical process of maintaining the tribal balance within the group.
- Interpreting it as a necessary sacrifice to appease the organizational spirits.
- Seeing it as part of the natural cycle of death and rebirth in team dynamics.
These teams might respond by:
- Performing unity rituals to strengthen bonds among remaining members
- Creating new team traditions to honor departed colleagues
- Establishing protective circles of trust to maintain group safety
Individual Perspective:
Individuals aligned with the Purple value system might interpret this correlation as:
- A spiritual test of their loyalty to the tribal group.
- A sign of their role in maintaining sacred organizational harmony.
- An opportunity to strengthen their connection to the group's ancestral wisdom.
These individuals might respond by:
- Seeking guidance from organizational elders or spiritual leaders
- Participating in protective rituals to ensure job security
- Strengthening their emotional bonds with remaining team members
This correlation, viewed through the Purple lens, suggests that those operating at the Purple level may be more accepting of staff reductions when framed within spiritual and traditional contexts. It implies that the Purple value system's focus on tribal wisdom, ancestral guidance, and maintaining sacred harmony aligns with a ritualistic and spiritually guided approach to organizational changes.
The reasons why Staff reductions might be seen as necessary in the Purple stage could include:
- Tribal Balance: Maintaining the sacred equilibrium of the organizational tribe
- Spiritual Cleansing: Periodic purification of the organizational energy
- Ancestral Guidance: Following traditional wisdom about group size and harmony
- Sacrifice for Protection: Ensuring the survival of the core tribal group
- Mystical Cycles: Aligning with natural rhythms of organizational life
This correlation prompts us to consider how traditional values and spiritual beliefs influence organizational decisions. It raises questions about the role of sacred traditions and tribal wisdom in modern business practices, particularly in contexts where spiritual and emotional bonds are crucial to organizational culture.
Ultimately, this correlation highlights the complex interplay between ancestral wisdom, group cohesion, and organizational survival. Staff reductions might be seen not as mere business decisions but as sacred acts of maintaining tribal harmony in Purple-dominant environments.
In our analysis of the poll "Factors that impact team effectiveness" (by Google), we found an intriguing positive correlation that warrants closer examination:
0.0231 between the Structure and clarity and the Red stage.
The critical value of the correlation coefficient for a non-normal distribution, by Spearman r = 0.0023. This positive correlation of 0.0231 meets the reliability criteria but does not necessarily imply causation.
This positive correlation of 0.0231 between Structure and clarity as a team effectiveness factor and the Red stage offers intriguing insights when viewed through the lens of the Red value system:
Organizational Perspective:
Organizations operating within the Red mindset might interpret this correlation as:
- A tool for establishing clear power hierarchies and dominance structures
- Validation that clear battle lines and territories lead to effective conquest
- Confirmation that defined arenas of combat enable stronger warriors to emerge
These organizations might respond by:
- Implementing rigid hierarchical structures that reward the strongest
- Creating clear territories and domains of power for different leaders
- Establishing explicit rules of engagement for internal competition
Team Perspective:
Teams operating from a Red mindset might approach this correlation by:
- Viewing it as a framework for establishing dominance within the group
- Interpreting it as a battlefield map for power plays and territorial gains
- Seeing it as a clear path to identify and challenge potential rivals
These teams might respond by:
- Setting up clear power structures within team dynamics
- Establishing explicit territories and responsibilities as conquest zones
- Creating visible rankings and hierarchies within the team
Individual Perspective:
Individuals aligned with the Red value system might interpret this correlation as:
- A roadmap for personal power acquisition and dominance
- Evidence that clear structures enable better opportunities for conquest
- Confirmation that defined hierarchies provide clear targets for advancement
These individuals might respond by:
- Actively mapping power structures to identify advancement opportunities
- Using clear organizational boundaries to plan strategic conquests
- Leveraging structural clarity to dominate their designated territory
This correlation, viewed through the Red lens, suggests that those operating at the Red level may value structure and clarity as tools for power and dominance. It implies that the Red value system's impulsiveness and desire for immediate gratification actually benefit from clear battlegrounds and explicit power hierarchies where they can assert their dominance.
The reasons why Structure and clarity might be valued as a factor of team effectiveness in the Red stage could include:
- Power Mapping: Clear structures provide explicit targets for conquest and domination
- Territory Definition: Clarity helps establish clear boundaries for power plays
- Battle Lines: Structure creates defined arenas for competition and conflict
- Dominance Hierarchy: Clear frameworks enable visible paths to power
- Combat Rules: Clarity provides understood parameters for power struggles
This correlation prompts us to consider how power-driven value systems leverage organizational structure. It raises questions about the role of clear hierarchies and boundaries in environments where immediate dominance and personal power are primary motivators.
Ultimately, this correlation highlights the complex interplay between organizational clarity and power dynamics. Structure and clarity might be seen not as constraints but as enabling factors for power acquisition and dominance in Red-dominant environments.
In our analysis of the poll "The main priorities of job seekers," we found an intriguing positive correlation that warrants closer examination:
0.0624 between the Financial stability of the employer and the Blue stage.
The critical value of the correlation coefficient for a normal distribution, by William Sealy Gosset (Student) r = 0.0608. This positive correlation of 0.0624 meets the reliability criteria but does not necessarily imply causation.
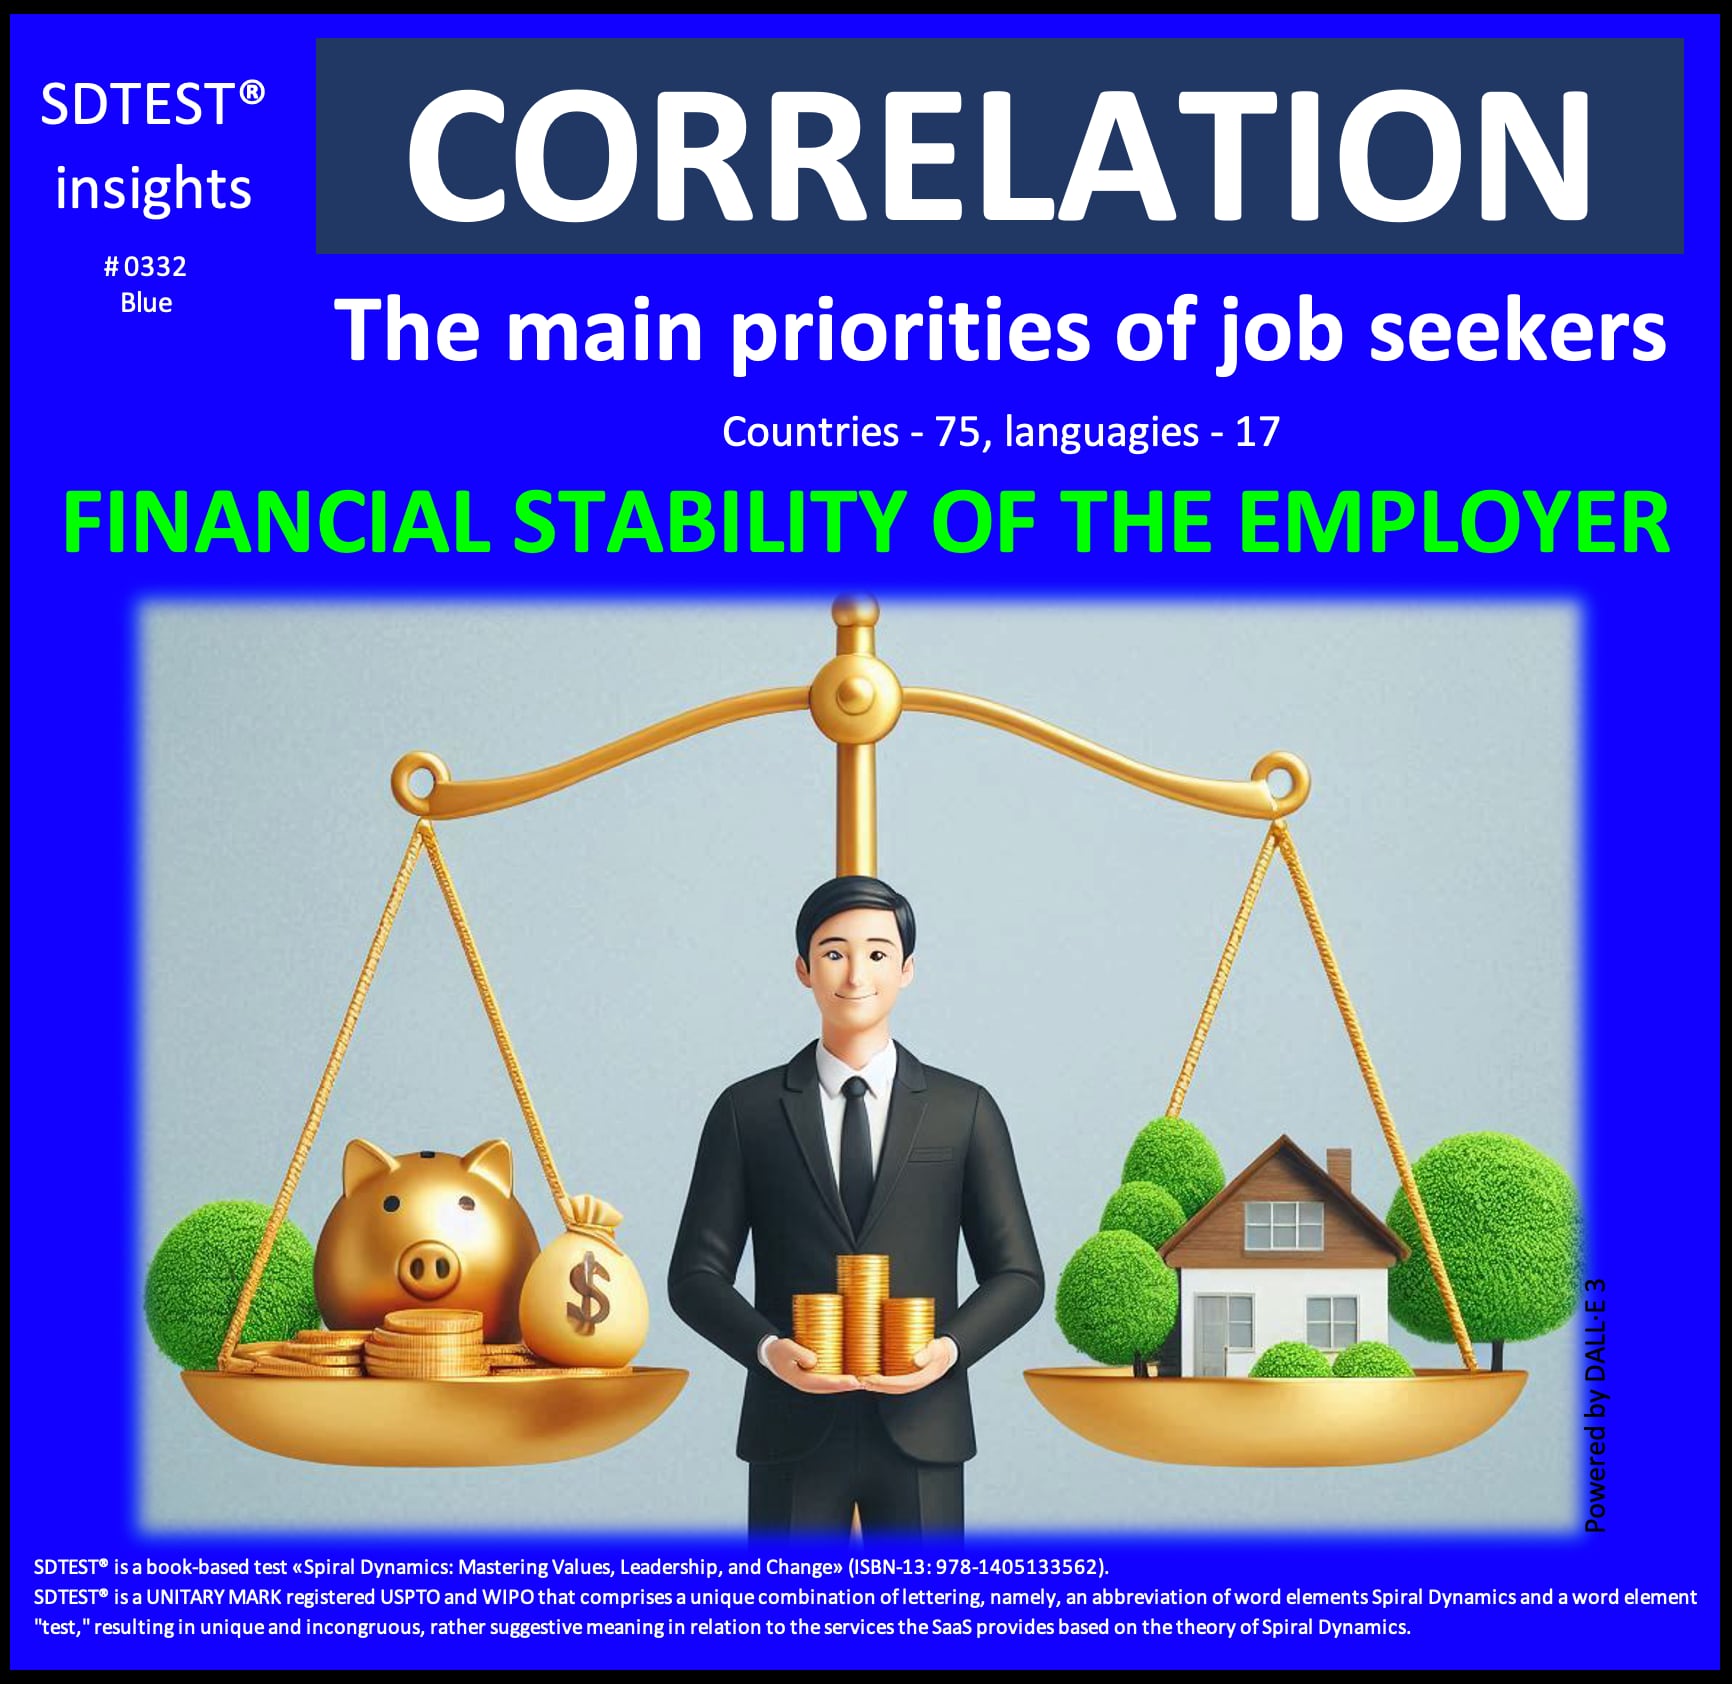
This positive correlation of 0.0624 between the Financial stability of the employer and the Blue stage offers intriguing insights when viewed through the lens of the Blue value system:
Organizational Perspective:
Organizations operating within the Blue mindset might interpret this correlation as:
- Validation of their commitment to maintaining strict financial discipline and order
- Confirmation that adherence to financial regulations and stability attracts dutiful employees
- Evidence supporting their belief in responsible, conservative fiscal management
These organizations might respond by:
- Implementing more rigorous financial reporting and transparency measures
- Creating detailed policies around financial stability and risk management
- Promoting their long-term financial planning and conservative fiscal approach
Team Perspective:
Teams operating from a Blue mindset might approach this correlation by:
- Viewing it as confirmation of proper organizational values and priorities
- Interpreting it as validation of structured, disciplined financial management
- Seeing it as justification for maintaining strict budgetary controls
These teams might respond by:
- Establishing formal procedures for budget monitoring and reporting
- Following rigid financial protocols and compliance measures
- Maintaining detailed documentation of financial processes and controls
Individual Perspective:
Individuals aligned with the Blue value system might interpret this correlation as:
- Affirmation of their preference for orderly, stable employment
- Validation of their belief in traditional career security
- Confirmation of their value for institutional reliability and proper authority
These individuals might respond by:
- Seeking positions in organizations with proven financial track records
- Adhering strictly to financial policies and procedures
- Supporting conservative financial decision-making
This correlation, viewed through the Blue lens, suggests that those operating at the Blue level deeply value employer financial stability as a reflection of proper order and moral responsibility. It implies that the Blue value system's emphasis on structure, tradition, and righteous behavior aligns perfectly with the desire for financially stable and properly managed organizations.
The reasons why the Financial stability of the employer might be prioritized in the Blue stage could include:
- Moral Duty: Financial stability represents responsible stewardship
- Order Maintenance: Stable finances indicate proper organizational management
- Traditional Values: Conservative financial practices align with established principles
- Hierarchical Security: Financial stability ensures proper organizational structure
- Righteous Operations: Sound financial management reflects moral correctness
This correlation makes us consider how traditional values and moral codes influence job-seeking behavior. It raises questions about the relationship between organizational financial stability and ethical conduct, particularly in contexts where order and proper authority are paramount.
Ultimately, this correlation highlights the complex interplay between financial responsibility, moral duty, and organizational righteousness. Financial stability might be seen as an economic condition and a moral imperative in Blue-dominant environments.
In our analysis of the poll "What makes people successful at work?" we found an intriguing positive correlation that warrants closer examination:
0.0661 between the Adaptability to Change and the Orange stage.
The critical value of the correlation coefficient for a normal distribution, by William Sealy Gosset (Student) r = 0.0394. This positive correlation of 0.0661 meets the reliability criteria but does not necessarily imply causation.
This positive correlation of 0.0661 between Adaptability to Change and the Orange stage offers intriguing insights when viewed through the lens of the Orange value system:
Organizational Perspective:
Organizations operating within the Orange mindset might interpret this correlation as:
- Scientific validation of the competitive advantage gained through adaptive capabilities
- Data-driven confirmation that change adaptation drives market success
- Empirical evidence supporting investment in innovation and flexibility
These organizations might respond by:
- Implementing metrics-driven change management systems
- Investing in technological solutions to accelerate adaptation
- Developing data-based frameworks for measuring adaptive capacity
Team Perspective:
Teams operating from an Orange mindset might approach this correlation by:
- Viewing it as quantifiable proof that adaptability enhances performance
- Interpreting it as statistical support for agile methodologies
- Seeing it as evidence that strategic flexibility yields measurable results
These teams might respond by:
- Establishing KPIs for measuring adaptation speed and effectiveness
- Implementing systematic approaches to change management
- Developing competitive benchmarks for adaptive performance
Individual Perspective:
Individuals aligned with the Orange value system might interpret this correlation as:
- Scientific validation of personal investment in adaptability skills
- Empirical support for strategic career advancement through flexibility
- Quantifiable evidence that change management abilities drive success
These individuals might respond by:
- Systematically developing their adaptive capabilities
- Measuring and optimizing their change response metrics
- Leveraging adaptability data for career advancement
This correlation, viewed through the Orange lens, suggests that those operating at the Orange level recognize adaptability as a scientifically validated success factor. It implies that the Orange value system's emphasis on rational analysis, competitive advantage, and measurable results aligns perfectly with the strategic importance of change adaptation.
The reasons why Adaptability to Change might be valued as a success factor in the Orange stage could include:
- Competitive Edge: Adaptability provides measurable market advantages
- Performance Metrics: Change response capabilities can be quantified and optimized
- Innovation Driver: Adaptation facilitates technological advancement
- Strategic Asset: Flexibility enables data-driven decision-making
- Success Indicator: Adaptability correlates with measurable achievement
This correlation makes us consider how scientific thinking and empirical evidence influence success strategies. It raises questions about the relationship between adaptability and performance optimization, particularly in contexts where rational analysis and measurable outcomes are paramount.
Ultimately, this correlation highlights the complex interplay between adaptive capability, competitive advantage, and strategic success. In Orange-dominant environments, adaptability might be seen not merely as a soft skill but as a quantifiable strategic asset.
In our analysis of the poll "Are you ready to receive less pay to work remotely?" we found an intriguing positive correlation that warrants closer examination:
0.0961 between the Yes, I am ready to receive 10% less pay to work remotely and the Green stage.
The critical value of the correlation coefficient for a normal distribution, by William Sealy Gosset (Student) r = 0.0619. This positive correlation of 0.0961 meets the reliability criteria but does not necessarily imply causation.
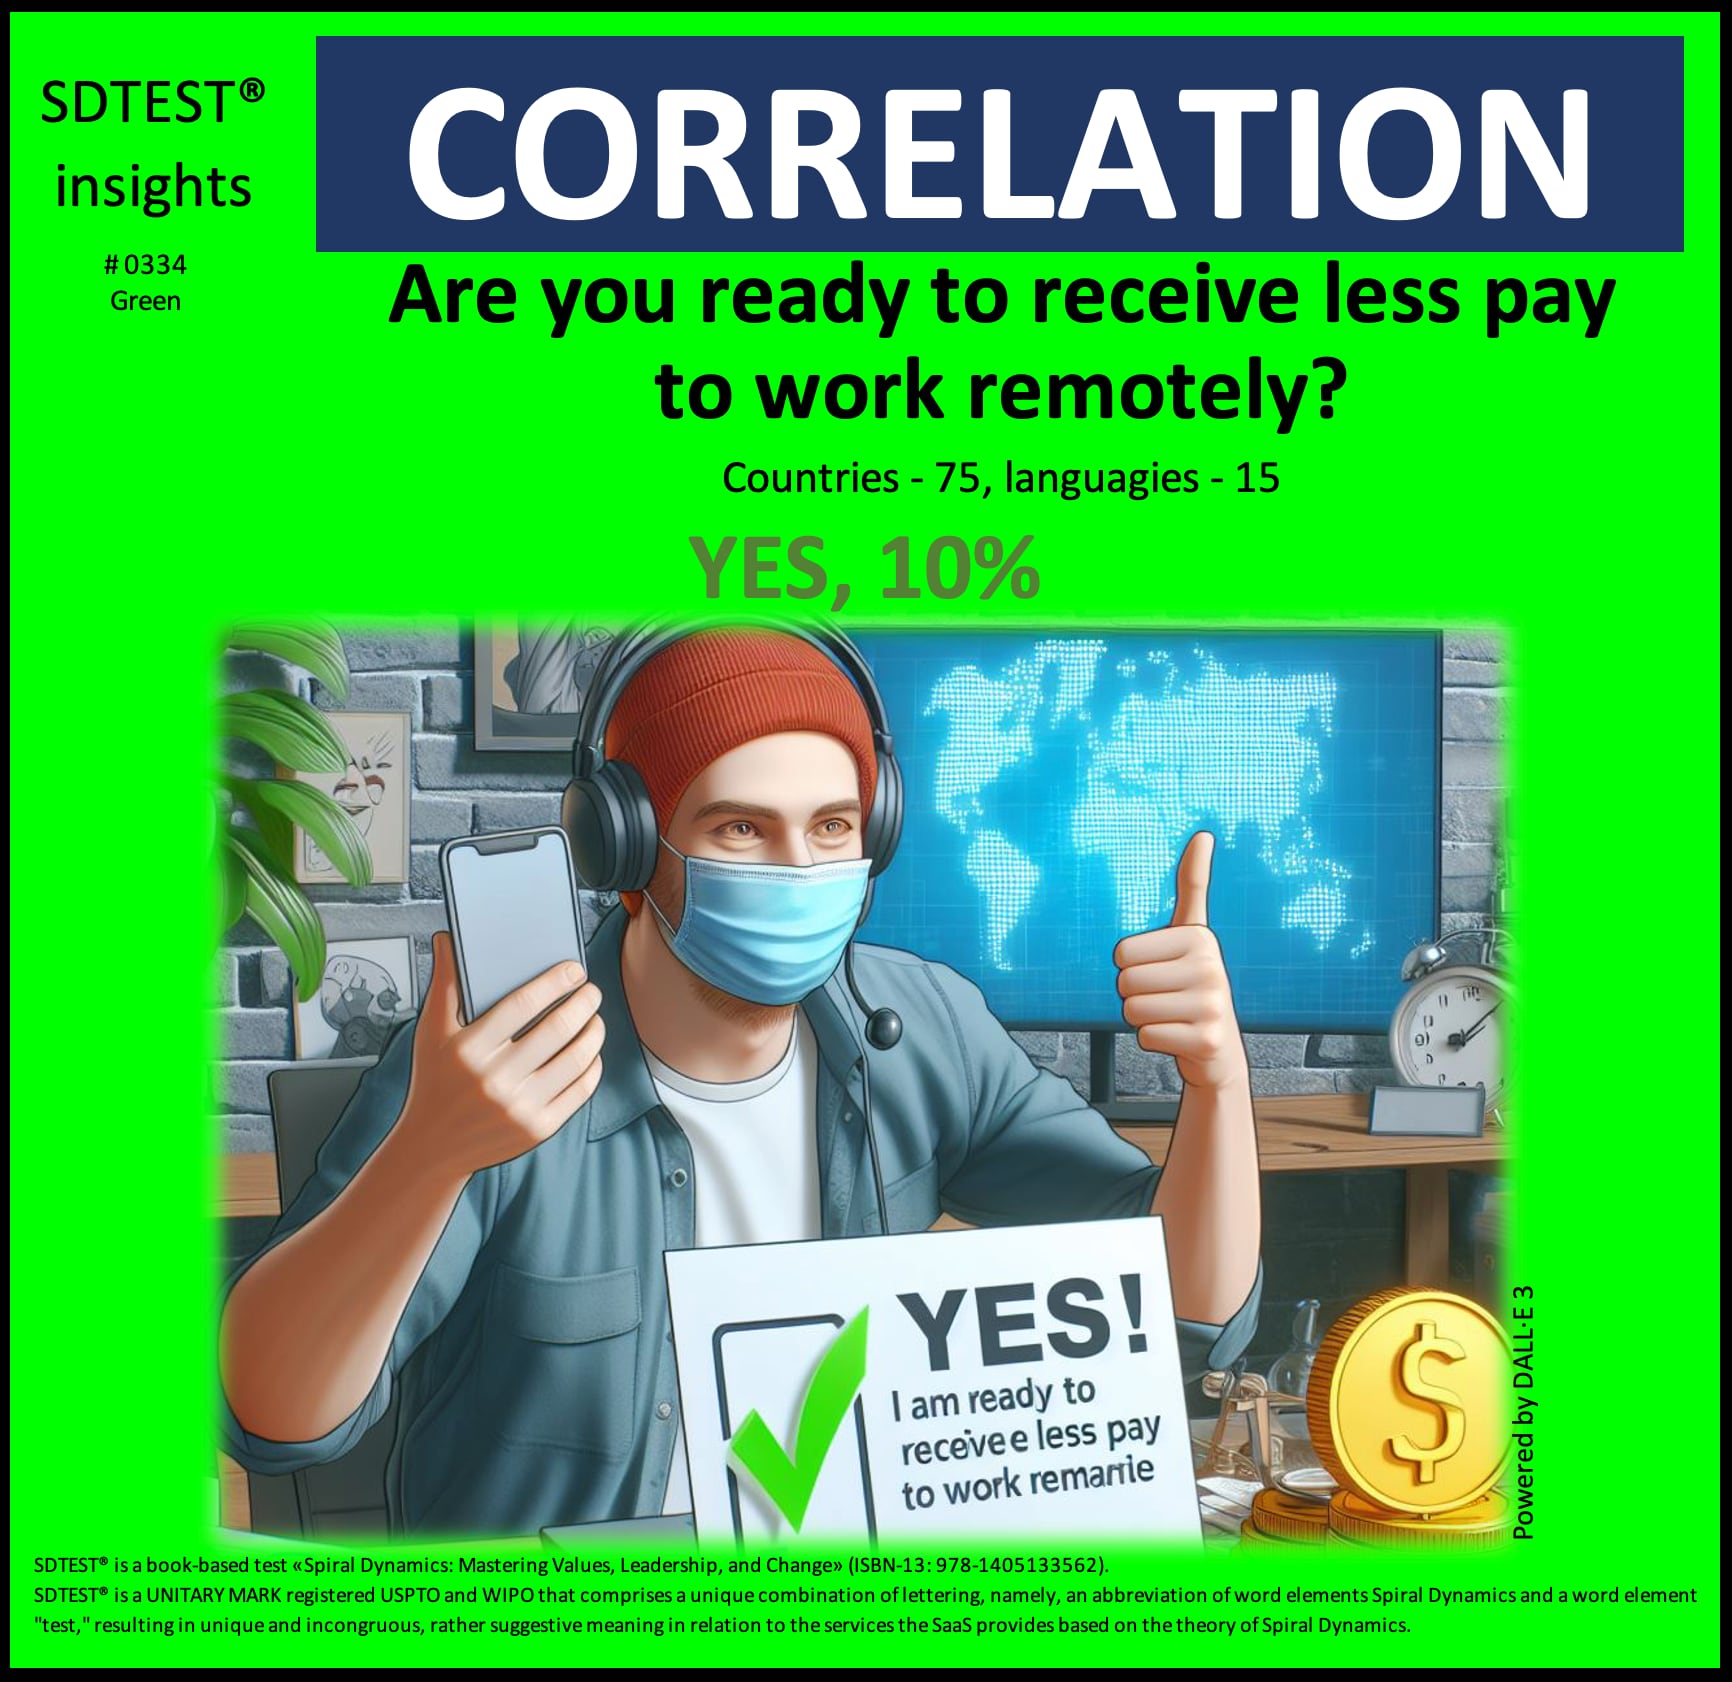
This positive correlation of 0.0961 between willingness to accept lower pay for remote work and the Green stage reveals fascinating insights when viewed through the lens of the Green value system:
Organizational Perspective:
Organizations operating within the Green mindset might interpret this correlation as:
- Validation of their commitment to environmental sustainability through reduced commuting.
- Confirmation that their employees value work-life harmony over monetary compensation.
- Evidence supporting their belief in creating more inclusive, flexible workplace cultures.
These organizations might respond by:
- Implementing comprehensive remote work policies that prioritize employee wellbeing.
- Creating collaborative virtual spaces that maintain community connection.
- Cost savings from reduced office space will be invested in sustainability initiatives and community programs.
Team Perspective:
Teams operating from a Green mindset might approach this correlation by:
- Viewing it as an affirmation of their commitment to work-life integration.
- Interpreting it as support for their focus on sustainable team practices.
- Seeing it as validation for prioritizing personal growth and community building over financial gains.
These teams might respond by:
- Developing new virtual collaboration methods that maintain team cohesion.
- Creating inclusive remote team rituals that celebrate diversity and connection.
- Establishing mentorship programs that support holistic professional development.
Individual Perspective:
Individuals aligned with the Green value system might interpret this correlation as:
- Personal validation of their choice to prioritize quality of life over monetary rewards.
- Evidence supporting their commitment to reducing environmental impact.
- Confirmation of their belief in the importance of work-life integration.
These individuals might respond by:
- Actively contributing to virtual community-building initiatives.
- Using saved commuting time for personal growth and community service.
- Sharing knowledge about sustainable remote work practices with colleagues.
This correlation, viewed through the Green lens, suggests that those operating at the Green level may be more likely to prioritize holistic well-being over financial compensation. It implies that the Green value system's focus on sustainability, community connection, and work-life integration aligns with a more conscious approach to workplace arrangements that benefit both people and the planet.
The reasons why individuals in the Green stage might be willing to accept lower pay for remote work could include:
- Environmental Impact: Reducing carbon footprint through eliminating commuting aligns with ecological values.
- Community Focus: More time for local community engagement and relationship building.
- Work-Life Integration: Better ability to balance personal, professional, and community responsibilities.
- Inclusive Accessibility: Remote work enables participation from diverse geographical and socioeconomic backgrounds.
- Sustainable Living: Lower expenses from commuting and professional attire support sustainable lifestyle choices.
This correlation makes us consider how different value systems influence workplace preferences and compensation priorities. It raises questions about the evolving nature of work and how organizations can create more sustainable, inclusive, and fulfilling work environments.
Ultimately, this correlation highlights the complex interplay between personal values, environmental consciousness, and workplace decisions. The willingness to accept lower compensation for remote work might reflect a broader shift toward prioritizing collective well-being and sustainable practices over individual financial gain in Green-dominant environments.
In our analysis of the poll "Ageism’s causes," we found an intriguing positive correlation that warrants closer examination:
0.1241 between the Yes, interpersonal interactions reflect broader social attitudes and the Yellow stage.
The critical value of the correlation coefficient for a normal distribution, by William Sealy Gosset (Student) r = 0.0852. This positive correlation of 0.1241 meets the reliability criteria but does not necessarily imply causation.
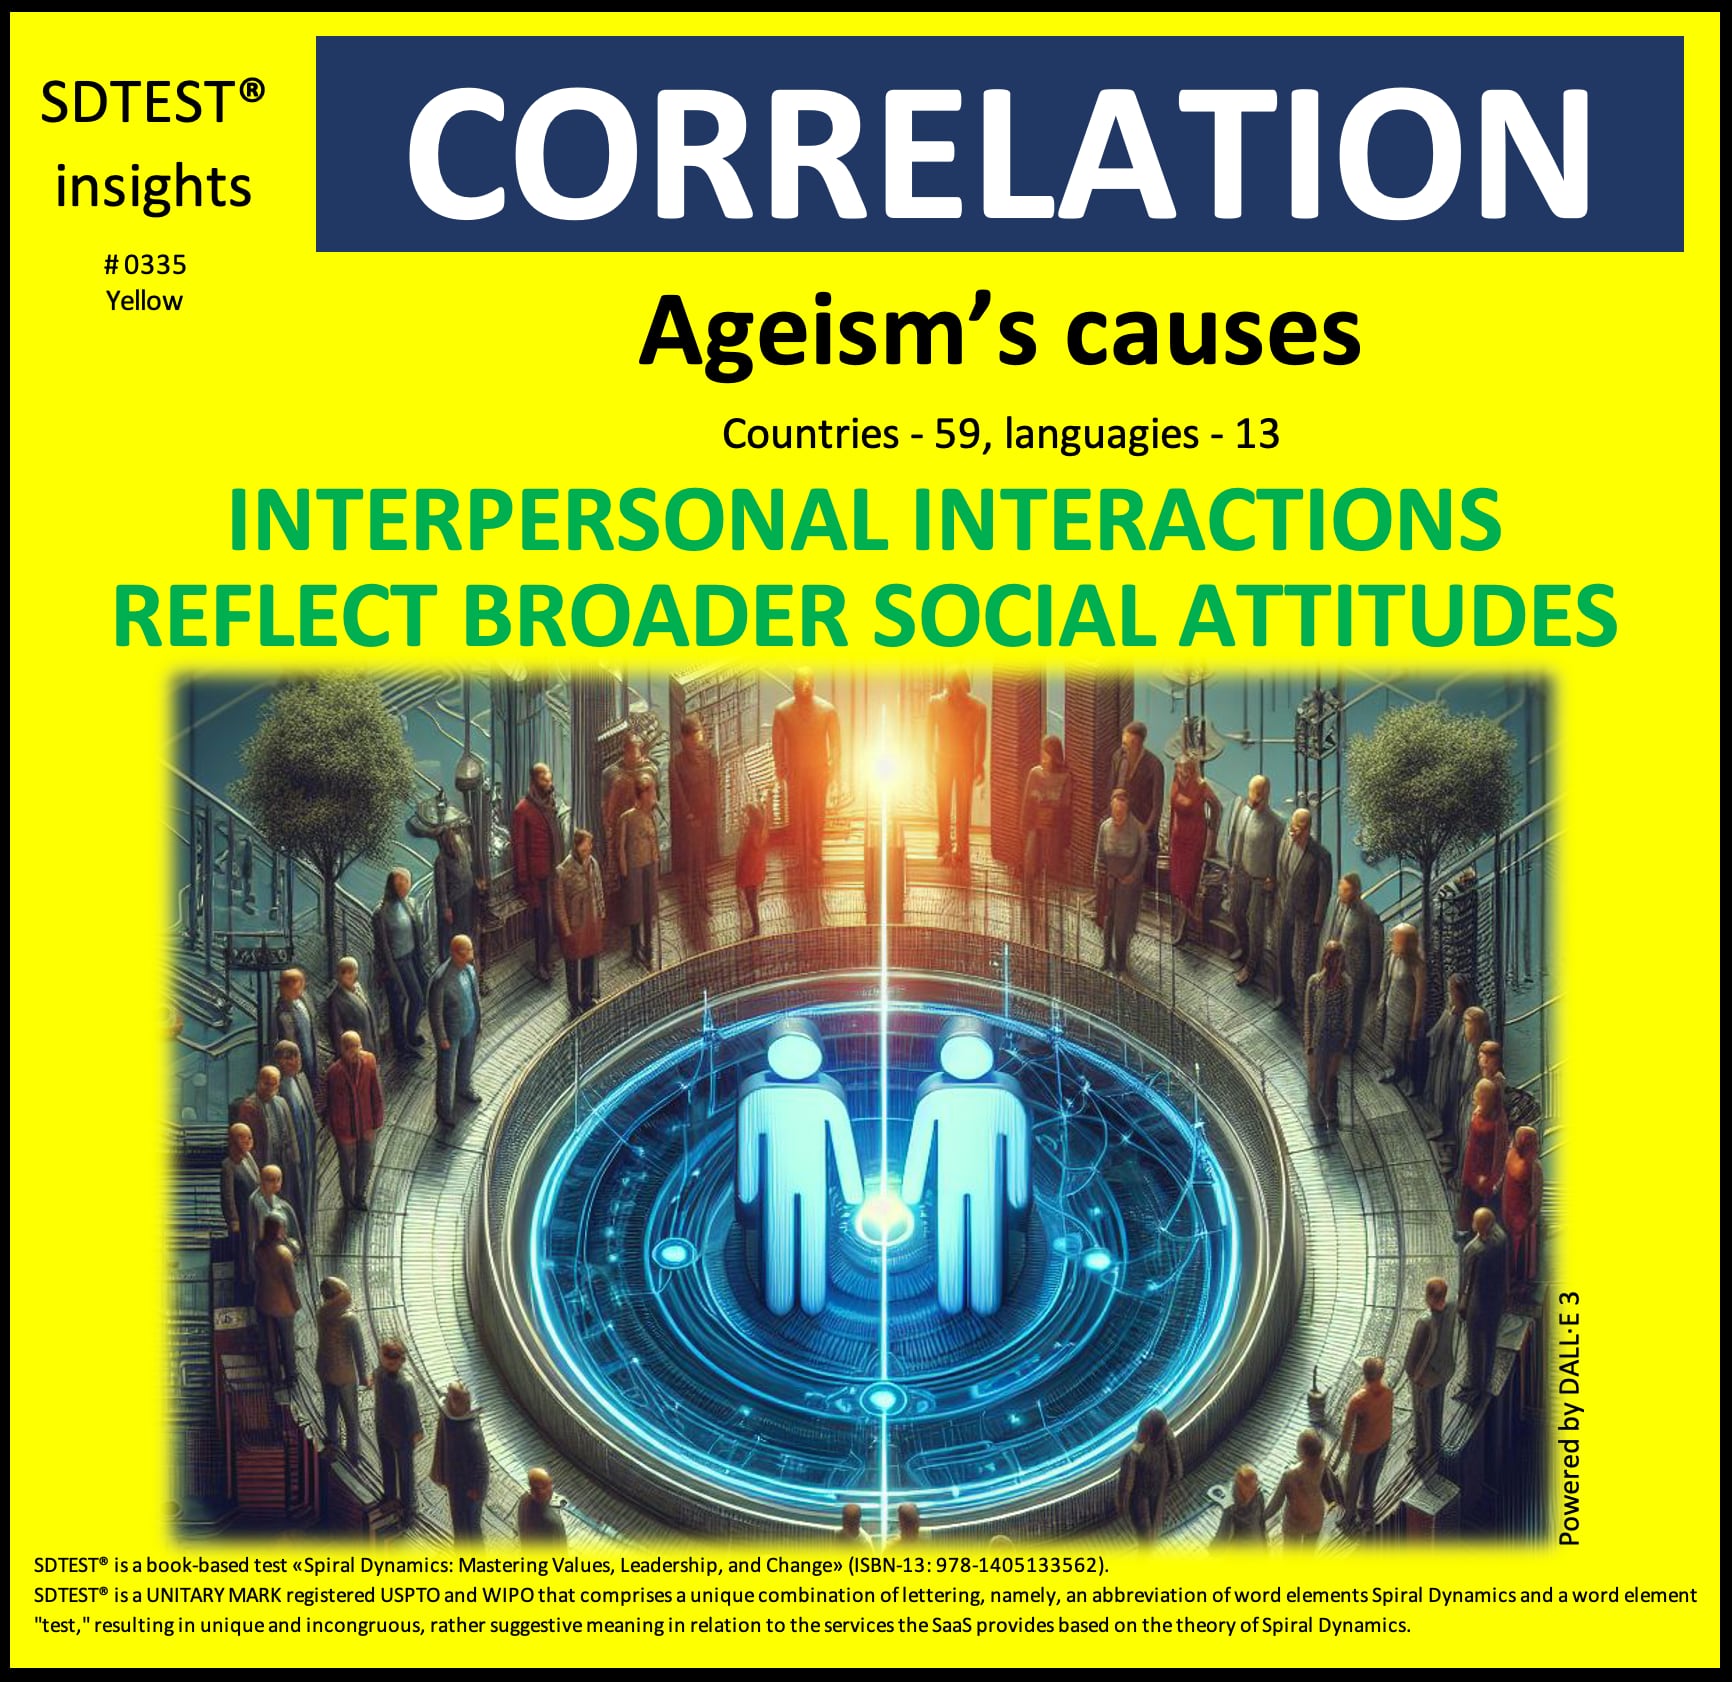
This positive correlation of 0.1241 between recognizing interpersonal interactions as reflections of broader social attitudes in relation to ageism and the Yellow stage offers intriguing insights when viewed through the lens of the Yellow value system:
Organizational Perspective:
Organizations operating within the Yellow mindset might interpret this correlation as:
- Validation of their understanding that ageist attitudes in workplace interactions mirror deeper societal biases.
- Confirmation that addressing ageism requires understanding both individual behaviors and systemic patterns.
- Evidence supporting their belief that organizational age diversity reflects and influences broader social attitudes.
These organizations might respond by:
- Implementing multi-generational mentoring systems that challenge age-related stereotypes.
- Developing age-inclusive policies that address both overt and subtle forms of ageism.
- Creating adaptive frameworks that recognize how societal age biases manifest in workplace interactions.
Team Perspective:
Teams operating from a Yellow mindset might approach this correlation by:
- Viewing it as affirmation that team dynamics often reflect societal age-related prejudices.
- Interpreting it as support for addressing both conscious and unconscious age biases.
- Seeing it as validation for creating age-diverse collaborative environments.
These teams might respond by:
- Designing interaction frameworks that challenge generational stereotypes.
- Creating spaces for dialogue about age-related biases and their societal roots.
- Developing innovative approaches to leverage multi-generational perspectives.
Individual Perspective:
Individuals aligned with the Yellow value system might interpret this correlation as:
- Personal validation of their role in perpetuating or challenging age-related social norms.
- Evidence supporting their need to examine their own age-related biases.
- Confirmation that personal interactions can either reinforce or transform societal ageism.
These individuals might respond by:
- Actively examining their own age-related assumptions and behaviors.
- Developing awareness of how their interactions might reflect societal age biases.
- Seeking opportunities to model age-inclusive behaviors and attitudes.
This correlation, viewed through the Yellow lens, suggests that those operating at the Yellow level recognize how interpersonal age-related interactions both mirror and perpetuate broader societal ageism. It implies that the Yellow value system's capacity for complex systems thinking enables a more nuanced understanding of how individual age biases connect to larger social patterns.
The reasons why interpersonal interactions might be seen as reflections of broader ageist attitudes in the Yellow stage could include:
- Systems Integration: Understanding how individual age biases connect to societal ageism.
- Pattern Recognition: Identifying how age-related stereotypes manifest across different social contexts.
- Complexity Understanding: Appreciating how personal age-related behaviors influence systemic ageism.
- Multi-perspective Integration: Ability to see ageism from various generational viewpoints.
- Evolutionary Awareness: Recognition of how changing age-related interactions can transform societal attitudes.
This correlation makes us consider how different value systems influence our understanding of ageism. It raises questions about the relationship between personal age biases and collective attitudes, particularly in contexts where generational diversity is crucial.
Ultimately, this correlation highlights the sophisticated interplay between interpersonal age-related interactions and societal ageism. In Yellow-dominant environments, this understanding becomes a powerful tool for transforming both individual and collective age-related attitudes.
In our analysis of the poll "Ageism in Life," we found an intriguing positive correlation that warrants closer examination:
0.0973 between the I notice ageism in personal life and the Turquoise stage.
The critical value of the correlation coefficient for a normal distribution, by William Sealy Gosset (Student) r = 0.0794. This positive correlation of 0.0973 meets the reliability criteria but does not necessarily imply causation.

This positive correlation of 0.0973 between noticing ageism in personal life and the Turquoise stage offers intriguing insights when viewed through the lens of the Turquoise value system:
Organizational Perspective:
Organizations operating within the Turquoise mindset might interpret this correlation as:
- Validation of their holistic understanding that ageism disrupts natural human interconnectedness.
- Confirmation that heightened awareness of age discrimination reflects evolutionary consciousness.
- Evidence supporting their belief that addressing ageism is crucial for collective human development.
These organizations might respond by:
- Creating living systems that naturally integrate multi-generational wisdom.
- Developing organic structures that honor the natural flow of human aging.
- Fostering environments where age diversity is seen as essential to universal harmony.
Team Perspective:
Teams operating from a Turquoise mindset might approach this correlation by:
- Viewing it as an affirmation of their role in healing age-related social fractures.
- Interpreting it supports their understanding of age as a natural life cycle phenomenon.
- Seeing it as validation for creating age-inclusive spaces that mirror natural ecosystems.
These teams might respond by:
- Cultivating environments where age differences are celebrated as part of life's natural rhythm.
- Creating sacred spaces for intergenerational wisdom sharing.
- Developing organic approaches to integrate diverse age perspectives.
Individual Perspective:
Individuals aligned with the Turquoise value system might interpret this correlation as:
- Personal validation of their heightened sensitivity to age-related disharmony.
- Evidence supporting their role in healing age-related social wounds.
- Confirmation of their responsibility to foster age-inclusive consciousness.
These individuals might respond by:
- Actively working to heal their own age-related biases and wounds.
- Developing deeper awareness of how ageism disrupts the natural human connection.
- Seeking opportunities to bridge generational divides through spiritual understanding.
This correlation, viewed through the Turquoise lens, suggests that those operating at the Turquoise level of know-how ageism disrupt the natural flow of human connection and development. It implies that the Turquoise value system's capacity for holistic understanding enables a more profound recognition of age-related social fractures.
The reasons why individuals in the Turquoise stage might be more likely to notice ageism in their personal lives could include the following:
- Universal Consciousness: Deep awareness of how ageism fragments human unity.
- Natural Systems Understanding: Recognition of how ageism disrupts natural life cycles.
- Spiritual Integration: Perception of age discrimination as a spiritual disconnection.
- Holistic Awareness: Ability to sense subtle forms of age-related discrimination.
- Evolutionary Perspective: Understanding of how ageism hinders collective human development.
This correlation makes us consider how different value systems influence our perception of age-related discrimination. It raises questions about the relationship between spiritual consciousness and social awareness, particularly in contexts where natural human development is concerned.
Ultimately, this correlation highlights the profound interplay between spiritual awareness and social consciousness. This understanding becomes a catalyst for healing age-related social fractures and fostering universal human connection in Turquoise-dominant environments.
What insights do you gain from today's correlation? How might we study this relationship more carefully before deducing causation?
We welcome respectful and wise perspectives! Stay tuned every week as we share more results and insights.
After login or registration, free access to the poll results in the FAQ section.
2024.12.01
FearpersonqualitiesprojectorganizationalstructureRACIresponsibilitymatrixCritical ChainProject Managementfocus factorJiraempathyleadersbossGermanyChinaPolicyUkraineRussiawarvolatilityuncertaintycomplexityambiguityVUCArelocatejobproblemcountryreasongive upobjectivekeyresultmathematicalpsychologyMBTIHR metricsstandardDEIcorrelationriskscoringmodelGame TheoryPrisoner's Dilemma
Valerii Kosenko
产品负责人 SaaS SDTEST®
Valerii 于 1993 年获得社会教育心理学家资格,此后将他的知识应用于项目管理。
Valerii 于 2013 年获得硕士学位以及项目和项目经理资格。在硕士学习期间,他熟悉了项目路线图 (GPM Deutsche Gesellschaft für Projektmanagement e. V.) 和 Spiral Dynamics。
Valerii 是探讨 V.U.C.A. 不确定性的作者。使用螺旋动力学和心理学数理统计的概念,以及 38 个国际民意调查。


